Seeing Monitor
The Seeing Monitor is a new application of the image quality measurement techniques that SharpCap has provided to assist focusing for some time. Instead of helping you find the point of best focus, you can now use the image sharpness measurements to help you capture the moments of clearest seeing without the eyestrain and fatigue usually associated with carefully watching the image to pick out seeing improvements.
Seeing Monitor is launched from the Tools Menu, and shows a chart of the recent range of image quality with the most recent values highlighted. This gives an objective measurement of when the seeing is at its best.
Every new frame is analysed for sharpness (contrast) and the results are added to the graph that will build up below the image. The quality of the results can be improved by selecting the area of interest using the selection area tool (for instance sunspots, prominences, craters). Using the standard colour scheme for focus measurements, sharp frames build the graph in green on the right hand side of the graph, poor frames build the left hand side in red.
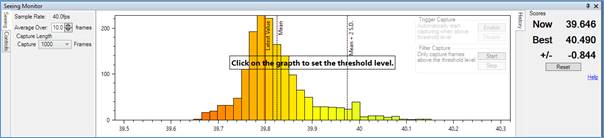
If the seeing is relatively constant then the graph will be like the one above with a single peak. If the seeing improves or worsens then a new peak will begin to build (to the right for improved seeing, to the left for worse seeing), like the image below. Note that other factors can also change the score and cause a new peak – for instance brightening or dimming caused by passing thin clouds.
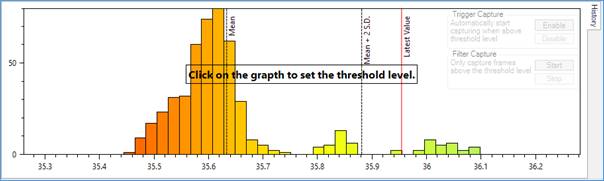
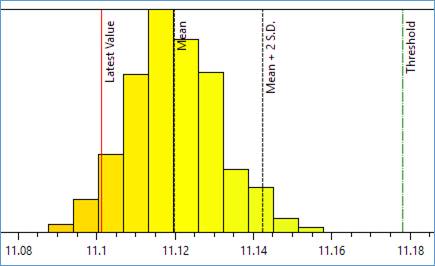
In both graphs you can see a number of vertical lines:
· Dashed line labelled Mean - The mean image quality value for all samples measured so far
· Dashed line labelled Mean + 2S.D. – The image quality value that corresponds to the mean plus two standard deviations. If the seeing is steady then you would only expect to see about 2% of frames exceed this level due to small random fluctuations.
· Solid red line labelled Latest Value – This shows the quality of the most recent frame recorded. If this line moves to the right of the Mean + 2SD line for any significant length of time then it is likely that the seeing has improved.
It is important to remember that other actions can cause the quality of the image to change – for instance
· Adjusting Focus
· Adjusting camera parameters such as gain or exposure
· Moving the selection area rectangle
· The image moving due for some reason (poor tracking, mount adjustments)
When any of these occur, press the Reset button to clear the graph and start accumulating new seeing data, otherwise the data may be misleading.
Configuring Seeing Monitor
On the left-hand side you will see a selection of controls allowing adjustments to be made to the Seeing Monitor settings.
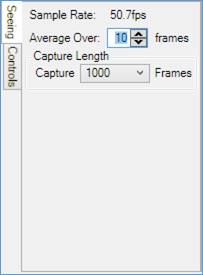
· Sample Rate – shows how often SharpCap is measuring the frame quality
· Average Over <X> frames – controls how many frame measurements are averaged together before plotting a new data point on the graph. Typically this should be set to a value between one half and one fifth of the sample rate to give a few new data points being added each second
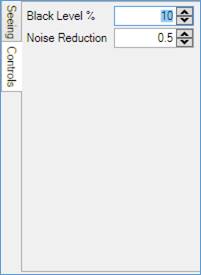
· Black Level – selects a brightness level in the image below which all detail will be ignored. Setting this appropriately ensures that noise in dark areas does not contribute to the image quality measurement
· Noise Reduction – allows the fine scale noise in the frames to be suppressed to prevent it from affecting the image quality measurement.
Finally, the Capture Length setting controls how many frames will be captured when a Seeing Triggered Capture begins – see below for more details.
Seeing Triggered and Seeing Filtered Capture
With a SharpCap Pro license, two additional functions become available – Seeing Triggered Capture and Seeing Filtered Capture. These functions help capture images when the seeing improves without the need to constantly watch the Seeing Monitor graph.
Both functions rely on setting a Threshold level in the seeing monitor graph, which can be set and adjusted by clicking on any point in the graph.
Both modes can be activated using the buttons found on the right-hand side of the graph.
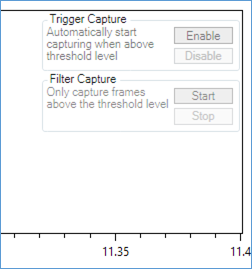
Seeing Triggered Capture will automatically start capturing when the Latest Value exceeds the Threshold Value and will then capture the number of frames given by the Capture Length setting in the left-hand controls region. Note that the specified number of frames will be captured even if the image quality then falls back below the Threshold level.
Seeing Filtered Capture works in a different way – when the Start button is pressed, SharpCap will immediately begin capturing, but will deliberately discard all frames where the frame image quality is below the Threshold Level. This will be reflected by the dropped frames count rising rapidly in the Status Bar. Only frames that meet or exceed the Threshold Level will be saved to the capture file. Capture will continue until the Stop Capture button on the toolbar or the Stop button is pressed.
Note: While Seeing Filtered Capture is active, the captured frame count shown in the status bar may seem to fluctuate slightly at times when all frames are being discarded. This behaviour is normal.
Note: Some frames may be saved to the output file even at times where the Latest Value line on the graph is below the Threshold line. This is because the position of the Latest Value line is an average of the image quality of a number of frames. The average value may be below the threshold, but a number of the individual frames that make up the average may have an image quality above the threshold.