Focusing
SharpCap has a several options to help acquire focus on targets (possibly one of the most challenging aspects of astrophotography). The tools are particularly powerful if an ASCOM focuser is configured in SharpCap (An ASCOM focuser is a device which uses a stepper motor or DC motor to move the telescope focuser and can be controlled from a computer via a USB cable).
Introduction
There are six Focus Score tools, the appropriate one must be chosen for the target. Each tool attempts to measure the quality of focus of the image (the different tools measure the quality of focus by different methods) and displays the measurement in the work area as both figures and a graph. The graph may look something like this:
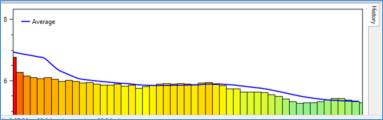
Green bars always indicate better focus while red bars always indicate poorer focus. The most recent measurements are shown at the right-hand side of the graph with older measurements to the left. Note, for some tools the best focus is associated with low scores (short bars in the graph), while for others it is associated with high scores (tall bars in the graph).
It is possible to just select one of the focus tools and adjust the focuser until obtaining the best score such that the score can no longer be improved by moving the focuser in either direction, but better results can be obtained with a full understanding of how the process works and the adjustments available.
Don't try to use the focus tools if the image is a long way out of focus. The tools are to be used to go from being close to focus to perfectly in focus. If focus is a long way out and there are problems getting anywhere near focus, try one of the following:
· Focus on a terrestrial object at least 200m away in daylight (the further the better), which will get close to the focus point for astronomical objects.
· Use the moon, if it is visible, as it is easy to find and bright. This helps because it can be hard to find any objects when the telescope is a long way out of focus. However, the moon is bright enough to be hard to miss even when the focus is very bad.
- With high gain and exposure of 2s or so, aim at a bright star or planet. Increase the brightness of the displayed image by one of the following:
-
- Reducing the mid-level value for the display stretch or using display auto stretch.
- Selecting 'Image Boost' from the FX dropdown.
- Selecting 'Image Boost More' from the FX dropdown.
If the bright object is either in or near the field of view, all or part of a bright donut (reflector/SCT) or bright disk (refractor) of light will be seen – this is the very out-of-focus view of the object, made visible by the high gain and brightness boost. Adjust the focuser of the telescope to make the disk/donut smaller, which will bring the telescope nearer to correct focus.
The Focusing Tools
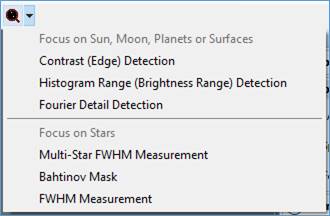
The six available focusing tools can all be found under the Calculate Focus Score icon from the Tool Bar. Select the desired tool to begin measuring focus. The tools come in two groups – one that is suitable for focusing on the Sun, Moon, Planets or a surface, the other group is suitable for focusing on stars.
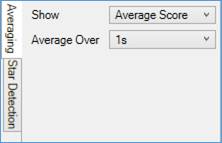
Each focus tool has settings for averaging – these setting control how many focus readings are averaged before adding a data point to the graph.
|
|
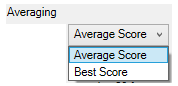
Averaging – choose either average or best score from an averaging period to be the value recorded. |
|
|
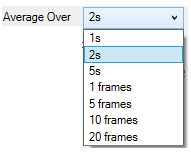
Average Over – the period can be specified as either number of frames or a time-period by the settings offered. Averaging is more useful for high speed imaging (lunar/solar/planetary) – for deep sky imaging, setting the Average Over option to 1 frame is usually sufficient.
|
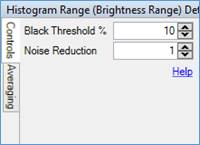
The tools also have settings to control the focus detection calculations – these vary from tool to tool. Most tools have the following options:
|
|
Black level – anything below that level is excluded from the calculation, avoids including dark level noise in the calculation. The level is measured in terms of the percentage of maximum brightness. |
|
|
Noise Reduction – applies a Gaussian blur to the image to cut down on pixel noise before performing the measurement. The amount of blurring can be adjusted. Note that the blurring is not shown in the image on screen when this is adjusted. |
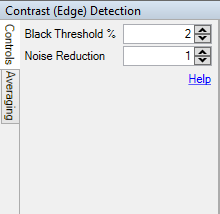
Each focus tool also has a small amount of built-in help available that can be shown by clicking or hovering over the ‘Help’ link. For example, this is the Help for Contrast (Edge) Detection:
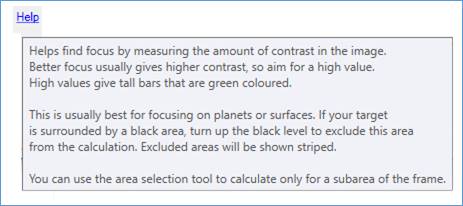
Contrast (Edge) Detection
Suitable for planetary or surface targets. Measures the total amount of contrast in the image - better focus gives more contrast which gives higher scores.
Tall green bars (high values) indicate the most contrast and hence best focus. Short red bars (lowest values) indicate the worst focus.
Histogram Range (Brightness Range) Detection
Suitable for planetary or surface targets (especially high noise). Measures the range between the brightest and dimmest parts of the image - better focus should give higher scores. May work better for noisy (high gain) images than Contrast (Edge) Detection.
Tall green bars (high values) indicate the most contrast and hence best focus. Short red bars (lowest values) indicate the worst focus.
Fourier Detail Detection
Suitable for planetary or surface targets. Measures focus by examining amount of detail in small scales in the image as determined by a Fourier Transform. Good focus leads to higher scores. May be less sensitive to noise than contrast detection options.
Tall green bars (high values) indicate the most contrast and hence best focus. Short red bars (lowest values) indicate the worst focus.
Multi-Star FWHM Measurement
Suitable for stars and point sources. Measures the FWHM (Full-width, Half Maximum – a measure of the width of the star) of all suitable stars in the frame, giving an average score. When a frame is out of focus, stars appear larger, making this measurement increase, so smaller values mean better focus.
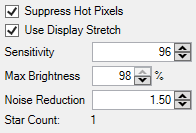
The Multi-Star FWHM score has a number of controls to adjust star detection. You should adjust these controls to try to detect at least 20 stars (but no more than a few hundred). Guidance on adjusting these controls can be found below.
At least five suitable stars must be detected for a valid score to be generated – if less than five stars are detected then a placeholder score of 25 is reported.
|
|
Suppress Hot Pixels – Enabling this option adjusts the star detection process to avoid detecting a star from a single hot pixel in the image. You may need to turn this off if you are using a large pixel camera and a short focal length telescope (i.e. your stars are very small). |
|
Use Display Stretch – when this option is selected, any display stretch applied to the image is also used for star detection to help detect faint stars. In general, leave this option selected. |
|
|
Sensitivity – This controls the overall sensitivity of the star detection process – increase this value to try to detect more stars, decrease it to reduce the number of stars being detected. Note the following: · Setting a higher sensitivity can make star detection take longer, potentially slowing down the stacking process · SharpCap will auto-adjust the sensitivity for you, turning it down (to a minimum of 75) if more than 200 stars are detected and turning it up (to a maximum of 75) if less than 25 stars are detected. |
|
|
Max Brightness – this is the maximum brightness level for stars to be considered for part of the FWHM measurement. Fully saturated stars are not included as it is impossible to tell how over-saturated they are, meaning that they can give inaccurate results. |
|
|
Noise Reduction – when enabled applies a Gaussian blur to help SharpCap to ignore low level noise and hot pixels. Increasing this may help detect stars correctly in noisy images. |
Short green bars (low values) are indicated best focus. Red bars (highest values) indicate worst focus.
Note that this option actually measures the half-flux-diameter, a property that is closely related to the FWHM, but is not so badly affected by noise or mis-shaped stars.
Bahtinov Mask
Suitable for stars or other point sources. Requires a Bahtinov mask to be placed over the aperture of the scope and the area around the star and lines to be selected using the selection tool. Best focus is achieved when all three lines intersect at the same point which gives scores (positive or negative) closest to zero.
A Bahtinov mask of suitable diameter must be placed over the end of the telescope to use the Bahtinov Focus Score tool. Negative values are possible, values nearest zero are best, so -0.1 and 0.1 are equally good, 0.0 is perfect and +3.9 and -3.9 are equally bad.
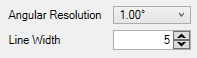
Angular Resolution and Line Width are controls found only in the Bahtinov focus score.
|
|
Angular Resolution – measured in degrees and defines how finely to scan the full 360 degrees when looking for Bahtinov lines – the default scans once per degree, but it can be made finer. Possible values are 0.20°, 0.25°, 0.33°, 0.5°, 1.0° Line width – measured in pixels and should be set to roughly the width of the Bahtinov spikes seen on the screen – the correct value here helps SharpCap separate the spikes from the noise. Possible values are 1..40 in increments of 5. |
Short green bars (low values) are best – values can be positive, negative or zero. A value of zero indicates best focus. Red bars with large values (either positive or negative) are worst.
FWHM Measurement
Suitable for stars or other point sources. Measures the width (FWHM) of a single star – which must be selected using the selection area tool. Better focus gives narrower stars and a lower FWHM score.
Multi-Star FWHM is usually better than single-star because it takes 10s or 100s of FWHM measurements and averages them, so there should be less noise and less systematic error in the reading.
Short green bars (low values) are indicated best focus. Red bars (highest values) indicate worst focus.
Which Focus Tool Should Be Used?
For a field of view with many visible stars, use Multi-Star FWHM.
For a single-star (or sparse) field use either FWHM or Bahtinov Mask.
For planetary or surface targets, there are three tools to choose from:
· Contrast (Edge) Detection
· Contrast (Brightness Range) Detection
· Fourier Detail Detection
When trying to focus a planetary or surface target consider the following:
· The different focus score algorithms are attempts to find a better balance between two opposing factors – sensitivity to being in good focus and insensitivity to noise.
· There are trade-offs involved in the various approaches. Which to use is going to be a matter of trial and error and/or personal preference. The Contrast (Edge) Detection tool is (probably) a good starting point in most circumstances.
Focusing Procedure
The table details the various steps to be followed to achieve good focus of the telescope.
|
Telescope (with ASCOM focuser) |
|
|
Preparation Phase · Initial visual focus with telescope against a distant object.
|
|
|
Setup Phase · Check target not over exposed using Image Histogram tool. · Select appropriate Calculate Focus Score tool – adjust black level, target detection parameters, ROI box – to obtain best focus score. · Reset the graph to wipe the score history.
|
|
|
Focusing Phase · Adjust telescope focuser manually, watch focus scores. Stop when best score obtained. · Telescope now in focus. |
Focusing Phase · Adjust telescope focuser using the Focuser controls in the camera control panel, watch focus scores. · Use the Graph tab. Stop when best score obtained. · Telescope now in focus. |
During the Setup Phase, the scores being shown are meaningless as they are changing because of changing the software parameters, not changing the focus of the telescope.
At the end of the Setup Phase, Reset the Graph to wipe the score history.
During the Focusing Phase, only adjust the telescope's focuser, not any of the settings within SharpCap – this is to ensure the changes seen in the focus score are only a result of the changes in focus of the telescope and are not influenced by anything else. If any SharpCap settings are changed during the focusing stage (for instance because a planetary target has shifted in the field of view and there is a need to update the ROI), reset the graph after making the adjustment – effectively starting the focusing phase again.
Focus will need to be checked throughout a session as it could change because of one or more of the following factors:
· Thin cloud over target.
· Changing atmospheric conditions.
· Change in temperature affecting telescope tube.
· Change in temperature affecting optics.
The table below shows what would be seen in SharpCap when using the appropriate Calculate Focus Score tool for a telescope both without and with an ASCOM focuser.
|
Telescope (no ASCOM focuser) |
Telescope (with ASCOM focuser) |
|
FWHM measurement for star. In this trace, the focuser was moved from a position of reasonable focus (initial yellow/green bars) to a position of poor focus (red bars) and back to a position of good focus (dark green bars). [Note: History tab only.] |
Contrast Edge Detection for a planet. In this case, the focuser was moved from an initial poor focus to a better focus and past best focus back to a poor focus position. [Note: History and Graph tabs.]
|
Overview of Display
When selecting one of theFocus Score tools, Contrast (Edge) Detection in this case, the following screen appears. This screen layout is the same for all six Focus Score tools.
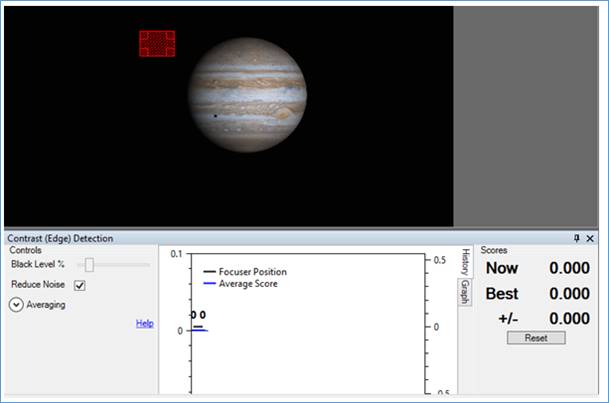
There are four distinct regions when a Contrast Focus Score tool is in use.
The Capture Display Area
|
|
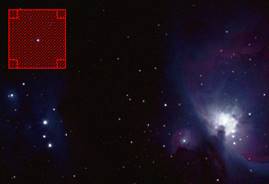
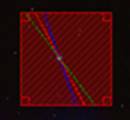
In the Capture Display Area, a red Selection Area rectangle appears. The rectangle can be dragged with the mouse and resized. It would be moved over the edge of the object, completely onto the surface, or expanded to surround the complete object.
· Any area outside the red rectangle will be excluded from focus score calculations. · Any area within the rectangle which is not shaded (above the black level) will be included for focus score calculations. · Any area within the rectangle which is shaded (below the black level), will be excluded from focus score calculations. |
The Controls Pane
|
|
· Various controls may be available depending on which focus score has been selected. See the focusing tools section for more detail. · Context sensitive Help is available. |
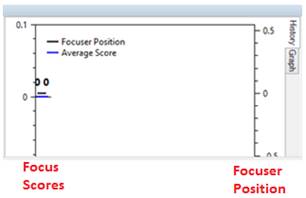
The Graphs
Pane
|
|
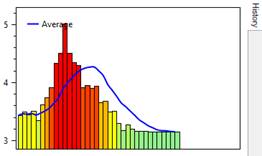
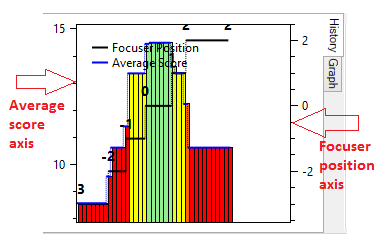
· The graph region will display a graphic for: Focus Score history (History tab) Focus Score v Focus Position graph (Graph tab). [Note: This only shows if there is an ASCOM focuser connected.] · The black line is used to indicate Focuser Position (explained later). · The blue line is Average Score – an average of the 10 previous focus scores. · The left hand vertical axis shows focus scores. · The right hand vertical axis shows focuser position. |
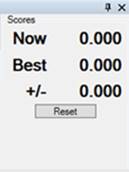
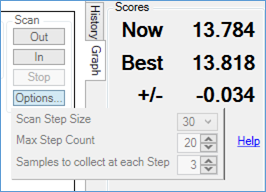
The Scores Pane
|
|
· The title bar of the panel can be used to drag the panel out of the main SharpCap form, for example to place it on a second monitor · The Pin icon can autohide the focus tool displayed in the Work Area. · Current score (Now) and Best score recorded so far (Best) are shown. · The Reset button clears the history and the best score. If the Selection Area is enabled, disabled or moved, or the Black Level changed, the Reset button should be used. |
The Graph Pane
The History tab always appears (1st diagram below). The additional Graph tab will only appear when an ASCOM focuser is connected (2nd diagram below).
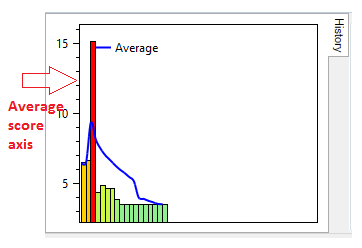
History Tab
The History tab shows the history of focus score values in a column graph with the oldest measurements on the left and the most recent measurements being added on the right.
The History tab is the default tab when you do not have an ASCOM focuser connected. While it can be used with an ASCOM focuser, the Graph tab is better suited for use with focusers.
|
No ASCOM focuser connected
|
· Blue 'average' line appears, an average of the last 10 focus score measurements, helps to see changes when the focus value is varying from frame to frame due to noise. · New measurements appear on the right, older ones will disappear from the left once the chart area is filled.
|
|
ASCOM focuser connected |
· Focuser Position axis on the right appears. · Black Focuser Position line appears. · Blue average line changes to a stepped graph. · Each horizontal segment of the average line corresponds to a period when the ASCOM focuser was at a certain position. · When the focuser position moves, a new segment starts. · The horizontal segments indicate the average focus score value over all the samples when the focuser was at that certain position. |
This is the range of colours that can be displayed – from red (poor focus) to green (good focus).
Red > Orange > Yellow > Light Green > Dark Green
Colours and heights of focus graph bars are not an absolute measure of 'good focus', they are a measure relative to the other recent focus measurements made. The best focus score recently obtained will always get a vivid green bar and will be the highest (lowest for FWHM) one in the graph. This doesn't mean perfect focus; it means the best focus achieved since the focus tool was opened (or since last reset). The exception to this is the Bahtinov mask tool - there the value of zero is an absolute measure of perfect focus.
Graph Tab
This graph only appears if an ASCOM focuser has been configured in SharpCap and is connected. In that case it becomes the default tab (although you can switch back to the History tab if you wish).
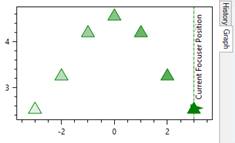
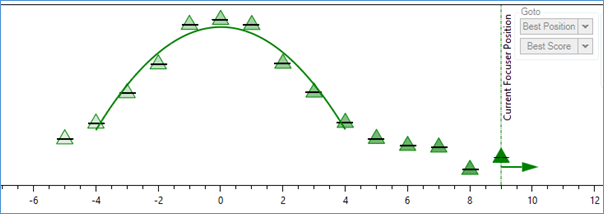
The Graph tab shows how the focus score measurements have varied with focuser position, with the focuser position being measured along the horizontal axis and the focus score being measured on the vertical axis.
Best focus is indicated by either a peak (maximum) at one point on the graph (contrast based focus scores) or a trough (minimum) at one point (star based focus scores).
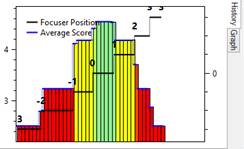
The graphic shows the focuser position was stepped from -3 to +3 in the following sequence:
-3 -2 -1 0 1 2 3
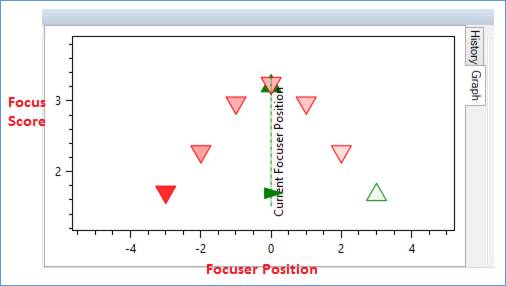
This graph shows the focuser position along the horizontal axis and the focus score on the vertical axis.
· The green upward pointing triangles show data points collected when the focuser was moving in the positive (outward) direction.
· The red downward pointing triangles show data points collected while the focuser was moving in the negative (inward) direction.
· Stronger colours indicate more recent data points.
· Faded colours indicate older data points.
The black lines and numbers on the History graph below correspond to the focuser positions shown in the Graph above.
With an ASCOM focuser installed, work from the Graph tab rather than the Histogram tab. To find the point of best focus using the focus score axis (at the left of the graph) look for:
· The peak value (Contrast Detection/Fourier options).
· Minimum value (FWHM options).
· Zero (Bahtinov option).
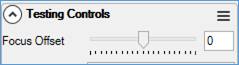
Note: This functionality can be experimented with using the Focus Offset control available in two Test Cameras. The focus offset control can be found in the Camera Control Panel, and will apply blurring to any image when it is set to a non-zero value.
History and Graph Manipulation
· Drag with left mouse button to move around.
· Mouse wheel to zoom.
· Select an area with middle or right mouse button to zoom to that area.
· Double click to return to default view if lost.
· Right click on the Graph area to show options for moving the ASCOM focuser to the position where you right-clicked.
|
|
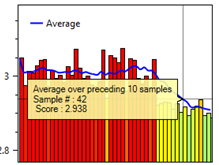
Hovering the mouse over the blue line will show focus score history of the preceding 10 samples. |
|
|
|
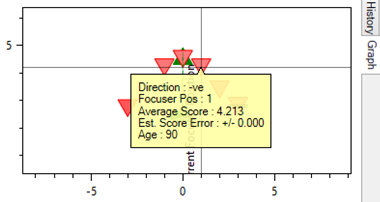
Hovering the mouse over the focuser graphics will display a focuser position and score report. |
|
|
|
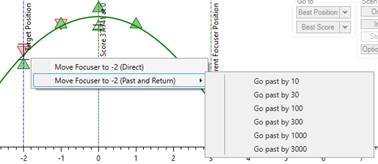
Right-clicking on the graph allows you to command the focuser to move to the position that you clicked on. Movement can either be direct or a ‘move past and return’ movement which can help deal with focuser backlash. |
|
Setting the Correct Black Level
For most focus score tools, setting the correct Black Level value will help give more reliable scores. Parts of the image that are below the Black Level brightness are not included in the focus score calculation. Note that the Multi-Star FWHM score does not require the black level to be set manually – it is handled automatically.
Before setting the black level, ensure the object is not over-exposed by viewing with the Image Histogram – avoid the Image Histogram hitting the right-hand side.
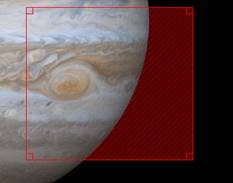
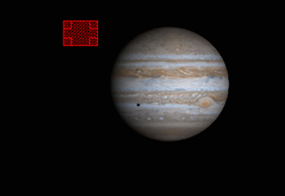
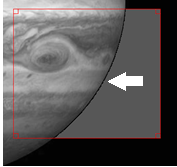
For a large planetary target, the optimum black level is when there is a thin black area between the object and the dark area. This can be difficult to see, so use the Zoom tool from the tool bar to improve the detail.
|
|
Contrast (Edge) Detection focus score used.
Here the Zoom is 100%. The black level happened to be 6.5% in this case.
The actual optimum percentage black level will vary depending on camera and settings. The picture illustrates how the black level shading should look when the black level is set correctly. |
When the ROI is over the planet, and everything within the ROI is part of the desired image. The requirement is to measure the focus of all of it. Hence in this case, the black level is set to low or zero.
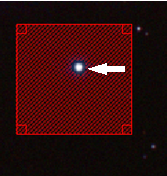
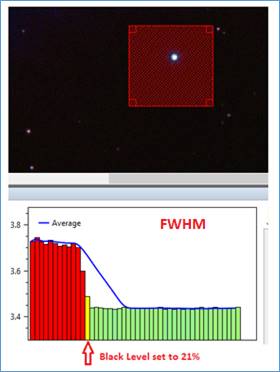
For a star as target, the optimum black level is when there is a thin black area between the object and the dark area. This can difficult to see, so use the Zoom tool from the tool bar.
|
|
FWHM focus score used.
Here the Zoom is 150%. The black level happened to be 21% in this case.
The actual optimum percentage black level will vary depending on camera and settings. The picture illustrates how the black level shading should look when the black level is set correctly. |
This is the effect of the correct black level on the focus score, making it clear the graph should always be reset after adjusting the black level or other parameters to avoid confusing the results of these adjustments with actual changes in the quality of focus.
Using a Bahtinov Mask
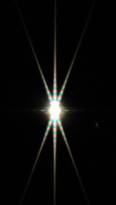
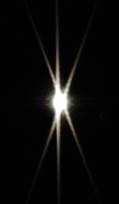
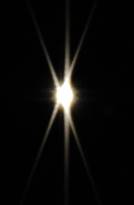
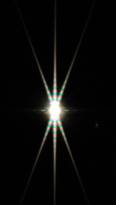
A Bahtinov mask must be fitted to the telescope for the Bahtinov mask focus score tool to work. Here are examples of diffraction patterns obtained using a Bahtinov mask in the conventional way, where the intersection of all three diffraction spikes at a single point indicates good focus.
|
|
|
|
|
Good |
Off to the left |
Off to the right |
The Bahtinov Mask is used for single stars, which must be selected with the region selection area. Good focus is indicated by short green bars. No bars, or a score of 0, indicated perfect focus.
When using the Bahtinov mask tool, ensure the Black Level control is set to a value that excludes the background area around the diffraction spikes from the focus score calculation but includes the entire visible diffraction spike area.
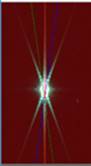
SharpCap attempts to detect the diffraction lines created by the Bahtinov mask and calculate whether they all meet at a single point (in focus) or not – SharpCap will draw coloured lines over the diffraction spikes as can be seen in the diagrams below.
Check the lines really are following the diffraction spikes, as sometimes the wrong lines will be detected and if this happens (as shown in the diagram on the right) the focus score will not be accurate. When the lines are detected incorrectly, it is usually possible to correct the problem by adjusting the black level or camera parameters such as gain or exposure.
|
Diffraction spikes |
SharpCap overlay |
Resulting graphic |
|
Diffraction spikes overlaid by the SharpCap mask gives the aligned graphic at focus. |
||
(Nearly) Automatic Focusing
When using an ASCOM focuser, SharpCap Pro users can activate additional features that allow many of the steps outlined above to be automated. The actions that can be automated are
· Scanning over a range of focuser positions, measuring the focus score at each position to produce a focus quality graph automatically.
· Returning automatically to the position at which the best focus score was measured
· Automatically re-scanning over the same range of focus positions and stopping automatically when the highest measured focus score is reached
All of these functions can be activated using the controls which are available in the top-right corner of the Focus Graph
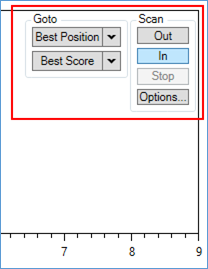
Note that the buttons in the Goto and Scan groups will appear slightly transparent until you move your mouse over them – this allows graph detail behind the buttons to be seen.
Automatic Focus Scanning
The Scan In and Scan Out buttons can be used to initiate an automatic scan over a range of focuser positions, measuring the quality of focus at each position. This is best started one side of the point of best focus so that the scan will pass through the expected position of best focus.
The details of the focus scan can be configured by pressing the Options… button and setting
· Scan Step Size – this is the amount of focuser movement between each focus measurement
· Max Step Count – this is the total number of steps of Scan Step Size to make during the focus scan
· Samples to collect at each Step – the number of focus score samples to use to measure the focus score at each step. Note that SharpCap will wait at least one frame to allow movement to settle at each step before starting measurement.
Note that if you have set an averaging option (perhaps to 5 frames) and you set 3 samples here then 15 frames 5*3 will be collected at each position.
The scan will continue, building up data in the Focus Graph until either
· The Stop button is pressed
· The focuser reaches its maximum or minimum possible position or
· The number of steps configured in the options has been completed
During the scanning process, information on progress will be shown in the notification bar.
![]()
Point of Best Focus Detection
SharpCap will monitor the focus data being accumulated during both automatic and manual focus movements and try to find a pattern in the data. In particular SharpCap is looking for the point of best focus, which will be indicated by a best-fit curve with either a peak (as shown below) or a valley. A valley shaped best-fit curve should be expected for focus scores where the lowest values are best (i.e. star FWHM measurements), a peak should be expected for scores where the highest values are best (i.e. contrast measurements).
The best-fit curve will indicate the position where best focus is expected to be found, even if it occurs between two measurement positions.
Note that the focus measurements must include at least two or three measurements each side of the point of best focus for the focus best-fit curve to be detected properly. If a focus scan stops at or before this point (i.e. the stopping point has the best score so far) then press the scan button again to continue the scan past the point of best focus.
A best fit curve will only show if there is a relatively strong pattern in the measurements showing a peak or a dip in the focus score. If the focus measurements are very variable with no distinct pattern then a curve will not appear. This problem is often caused by the movement of the focuser being within the ‘backlash’ region, such that even though the motor is turning the focuser itself is not moving the camera.
Once the best-fit curve is shown and has a clear peak or valley, the Go To Best Position or Go to Best Score options can be used to return the focuser to the point where the best focus was achieved.
Returning to Best Focus
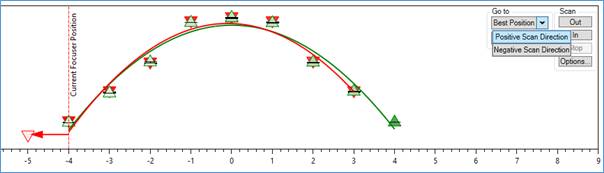
SharpCap can return to either the focuser position where the best focus score was obtained, or attempt to return the focuser to a position where the score matches the best score obtained so far via the two ‘Go To …’ buttons.
Each of these buttons has a dropdown to allow choice of which direction of movement to use the best data from – positive (outward) or negative (inward). The Focus Graph can show two best fit lines (green for movement in the outward direction, red for movement in the inward direction). If the focuser hardware has any significant backlash then these lines may not peak in the same position, making it important to be able to choose between them.
The default action of the Go To buttons (if you do not choose from the dropdown but just press the button) is to choose the direction that was scanned most recently.
Whichever direction of scan is chosen, and regardless of the choice between using Go to Best Position and Go to Best Score, SharpCap will always move the focuser so as to approach the best focus position in the same direction as the scan data being used, moving the focuser past the best focus region if necessary first to allow approach from the correct direction. This is necessary to keep the effect of any focuser mechanism backlash to a minimum
Go to Best Focus Position
The Go to Best Position button is the best option if your focuser has minimal backlash and can accurately return to a previous focus position. Focusers based on stepper motors generally fall into this category.
When this button is pressed, SharpCap will calculate the focuser position for the optimum point on the best-fit curve and then move the focuser to that position (from the same direction as the curve measurements were made to minimize backlash). This should place your telescope into best focus.
Go to Best Focus Score
The Go to Best Score button is the best option if your focuser is less accurate and has trouble returning to exactly the same physical position when the same focuser position number is selected. Focusers based on DC motors generally fall into this category.
When this button is pressed, SharpCap will attempt to find a position where the focus score matches (or is close to matching) the peak value measured in the previous focus scan. The target score that SharpCap will try to achieve is the average of the two best scores measured in the previous focus scan. This procedure will involve making a second focus scan in the same direction and stopping when the target focus value is reached, and will therefore take longer than the alternative of using the Goto Best Focus Position button.
Automatic focusing with a Bahtinov Mask
The discussions of automatic focussing above concentrate on focus score methods such as Contrast Detection and FWHM Measurement which give either a maximum value or minimum value at the point of best focus. When using the Bahtinov Mask focus tool, the best focus is at the point where the focus score is zero.
The automatic focussing routines described are capable of working with the Bahtinov mask tool and will properly return to the point where the focus score is zero.
ASCOM Focusers and Backlash
Backlash in the focuser mechanism will be present in all real focusers and shows itself as the best focus point appearing in differing positions depending on which direction the focuser is moving. So, if the peak focus score is at focuser position 20100 when the focuser is moving in the positive (+ve) direction, it could be at 19900 when moving in the negative (-ve) direction. If trying to return the focuser to the position where the score was at its best, always approach from the same direction used when measuring the focus to avoid errors caused by backlash.
Ideally, you should calculate the amount of backlash in your focuser (the difference between the best focus position in the positive and negative directions) and configure SharpCap to correct for that amount of backlash. See Focuser configuration.
Fully Automatic Focusing
Fully automatic focusing (for deep sky images) is available via the Sequencer and the Sequence Planner. Fully automatic focusing builds on the scan and return to best position steps described above, so it is best to ensure that those steps work before using fully automatic focusing.